Chart your first answer
In this tutorial, you’ll add a chart to the project the Quickstart left you. You’ll ask the same question from a script, run the SQL yourself, let the model pick a chart without showing it a row, and draw that chart with ECharts. At the end, a chart of what each customer spent is open in your browser.
You draw with ECharts here, but AskDB isn’t tied to it. AskDB returns a chart spec, and any charting library can draw it. The one piece you write for your library is a small function that maps the spec to that library’s config. Step 4 of Chart a query result has it for two libraries, in the tabs “ECharts” and “shadcn/ui (Recharts)”.
Before you start
Section titled “Before you start”You need:
- The project from the Quickstart, in its
askdb-shopfolder. It holdsshop.db, theaskdb/folder and.env. Run every command on this page in that folder. - An OpenAI API key in
.env, which is what the Quickstart’s steps set up. If you chose Anthropic or Google there, Bring your own model shows how to build that provider’s model for step 1.
The two files you’ll write, first-chart.mjs and to-echarts.mjs, are in examples/chart-a-result. Compare yours with them if a step doesn’t work.
The output on this page is from one recorded run of that example’s chart.mjs, with gpt-4o-mini on 2026-11-15. The model writes the SQL and the chart’s title, so yours can differ.
1. Ask the question from a script
Section titled “1. Ask the question from a script”In the Quickstart, you asked with the askdb ask command and piped the SQL into run-query.mjs. A chart needs the question, the SQL and the rows in one place, so now you’ll do both from one script.
First, add the packages the script uses:
npm install @askdb/client @askdb/core ai @ai-sdk/openai echartspnpm add @askdb/client @askdb/core ai @ai-sdk/openai echartsyarn add @askdb/client @askdb/core ai @ai-sdk/openai echarts zodYarn 4 gives a package only the packages you list for it, and @ai-sdk/openai needs zod. npm and pnpm install it for you.
@askdb/core has ask(), which returns checked SQL as askdb ask does. @askdb/client has the chart functions. ai and @ai-sdk/openai build the model, and ECharts draws the chart.
Now create first-chart.mjs:
import { DatabaseSync } from "node:sqlite";import { openai } from "@ai-sdk/openai";import { ask, loadSchema } from "@askdb/core";
const question = "How much has each customer spent in total, highest first?";const model = openai(process.env.OPENAI_MODEL || "gpt-4o-mini"); // reads OPENAI_API_KEY
// 1. AskDB returns the SQL. Your own code runs it.const { sql } = await ask({ question, schema: loadSchema("./askdb"), model, dialect: "sqlite" });const statement = new DatabaseSync("shop.db", { readOnly: true }).prepare(sql);const rows = statement.all().map((row) => ({ ...row })); // plain objects, for ECharts in step 4console.log(sql);console.table(rows);
The script builds the model from the key in .env and asks your question. Then it runs the SQL on shop.db, read-only, as run-query.mjs did. Run it:
node --env-file=.env first-chart.mjsnode --env-file=.env first-chart.mjsyarn node --env-file=.env first-chart.mjsYarn 4 keeps packages where plain node doesn’t look, so yarn node starts Node with Yarn’s package lookup.
--env-file=.env gives the script the API key you put in .env in the Quickstart. The output should look something like this:
SELECT customers.name, SUM(products.price * orders.quantity) AS total_spentFROM customersJOIN orders ON customers.id = orders.customer_idJOIN products ON orders.product_id = products.idGROUP BY customers.idORDER BY total_spent DESC;┌─────────┬────────────┬─────────────┐│ (index) │ name │ total_spent │├─────────┼────────────┼─────────────┤│ 0 │ 'Grace' │ 398 ││ 1 │ 'Margaret' │ 377 ││ 2 │ 'Ada' │ 138.99 ││ 3 │ 'Linus' │ 49.99 │└─────────┴────────────┴─────────────┘That’s the Quickstart’s answer again, this time from your own script. Notice that the script keeps the rows in rows. The next steps use them, and the model never gets them. On Node 22, Node also prints an ExperimentalWarning about SQLite, as it did in the Quickstart.
2. Classify the columns
Section titled “2. Classify the columns”To pick a chart, you need to know what each column holds: names to group by, or numbers to plot. classifyResult() works that out in your own process, with no model call. Add the highlighted lines:
- The import from
@askdb/client/charts, which also brings inplanChartfor step 3. - The lines under the
// 2.comment.
import { DatabaseSync } from "node:sqlite";import { openai } from "@ai-sdk/openai";import { classifyResult, planChart } from "@askdb/client/charts";import { ask, loadSchema } from "@askdb/core";
const question = "How much has each customer spent in total, highest first?";const model = openai(process.env.OPENAI_MODEL || "gpt-4o-mini"); // reads OPENAI_API_KEY
// 1. AskDB returns the SQL. Your own code runs it.const { sql } = await ask({ question, schema: loadSchema("./askdb"), model, dialect: "sqlite" });const statement = new DatabaseSync("shop.db", { readOnly: true }).prepare(sql);const rows = statement.all().map((row) => ({ ...row })); // plain objects, for ECharts in step 4console.log(sql);console.table(rows);
// 2. Classify the columns, here in your own process.const columns = statement.columns().map(({ name }) => ({ name }));const result = classifyResult({ columns, rowCount: rows.length, rows });console.log(result.shape);
Run the script again, with the same command as in step 1. After the SQL and the rows, it now prints this:
{ columns: [ { name: 'name', kind: 'category' }, { name: 'total_spent', kind: 'currency' } ], rowCount: 4, truncated: false}name is a category, and total_spent is currency. Notice what isn’t here: no Grace, no 398. The column names, their kinds and the row count are all the model will get of your result.
3. Ask the model for a chart
Section titled “3. Ask the model for a chart”Now you pass planChart() the question, the SQL and that classified result, with the same model that wrote the SQL. Of the result, only its shape reaches the model. Add the highlighted lines, the ones under the // 3. comment:
import { DatabaseSync } from "node:sqlite";import { openai } from "@ai-sdk/openai";import { classifyResult, planChart } from "@askdb/client/charts";import { ask, loadSchema } from "@askdb/core";
const question = "How much has each customer spent in total, highest first?";const model = openai(process.env.OPENAI_MODEL || "gpt-4o-mini"); // reads OPENAI_API_KEY
// 1. AskDB returns the SQL. Your own code runs it.const { sql } = await ask({ question, schema: loadSchema("./askdb"), model, dialect: "sqlite" });const statement = new DatabaseSync("shop.db", { readOnly: true }).prepare(sql);const rows = statement.all().map((row) => ({ ...row })); // plain objects, for ECharts in step 4console.log(sql);console.table(rows);
// 2. Classify the columns, here in your own process.const columns = statement.columns().map(({ name }) => ({ name }));const result = classifyResult({ columns, rowCount: rows.length, rows });console.log(result.shape);
// 3. Ask the model which chart fits. It gets the question, the SQL and result.shape.const plan = await planChart({ question, sql, result, model, dialect: "sqlite" });console.log(plan);
Run the script again. It makes a second model call, and then prints the plan:
{ primary: { type: 'horizontal-bar', category: 'name', series: [ 'total_spent' ], title: 'Total Spending by Customers (Highest First)', description: 'Displays the total amount spent by each customer, ranked from highest to lowest.' }, source: 'model', latencyMs: 1287}primary is a chart spec. It names a chart type, the column for the labels (category), the columns to plot (series), a title and a description. It holds no rows, and it draws nothing. Drawing is your job, as running the SQL was. source says the model picked this chart, and latencyMs says how long that took.
4. Draw the chart
Section titled “4. Draw the chart”ECharts draws from an option object, so you need a function that turns a chart spec into one. This function is the only part of the tutorial that’s tied to ECharts. For shadcn/ui, the “shadcn/ui (Recharts)” tab in step 4 of the guide has the same mapping as a React component. Create to-echarts.mjs:
/** * Turns a chart spec from @askdb/client/charts into an ECharts option. * ECharts reads your rows from `dataset.source` and picks columns by name with `encode`, * so the spec's `category` and `series` go in as they are. * A metric is one number, not a chart: it gets no option. * * @param {import("@askdb/client/charts").ChartSpec} spec * @param {Record<string, unknown>[]} rows * @returns {import("echarts").EChartsOption | null} */export function toEChartsOption(spec, rows) { if (spec.type === "metric") return null; const base = { title: { text: spec.title, subtext: spec.description }, dataset: { source: rows }, tooltip: {}, }; if (spec.type === "pie") { return { ...base, series: [{ type: "pie", encode: { itemName: spec.category, value: spec.series[0] } }] }; } const horizontal = spec.type === "horizontal-bar"; const categoryAxis = { type: "category", inverse: horizontal }; // inverse: the first row at the top const valueAxis = { type: "value" }; return { ...base, legend: { show: spec.series.length > 1, bottom: 0 }, grid: { top: 80 }, xAxis: horizontal ? valueAxis : categoryAxis, yAxis: horizontal ? categoryAxis : valueAxis, series: spec.series.map((column) => ({ type: spec.type === "line" || spec.type === "area" ? "line" : "bar", name: column, ...(spec.type === "area" ? { areaStyle: {} } : {}), encode: horizontal ? { x: column, y: spec.category } : { x: spec.category, y: column }, })), };}It has a path for each chart type a chart spec can name. Your chart spec takes the horizontal-bar path: one bar per row, with the names down the side.
Now draw the chart from your rows. Add the highlighted lines to first-chart.mjs: the three new imports, and the lines under the // 4. comment.
import { writeFileSync } from "node:fs";import { DatabaseSync } from "node:sqlite";import { openai } from "@ai-sdk/openai";import { classifyResult, planChart } from "@askdb/client/charts";import { ask, loadSchema } from "@askdb/core";import * as echarts from "echarts";import { toEChartsOption } from "./to-echarts.mjs";
const question = "How much has each customer spent in total, highest first?";const model = openai(process.env.OPENAI_MODEL || "gpt-4o-mini"); // reads OPENAI_API_KEY
// 1. AskDB returns the SQL. Your own code runs it.const { sql } = await ask({ question, schema: loadSchema("./askdb"), model, dialect: "sqlite" });const statement = new DatabaseSync("shop.db", { readOnly: true }).prepare(sql);const rows = statement.all().map((row) => ({ ...row })); // plain objects, for ECharts in step 4console.log(sql);console.table(rows);
// 2. Classify the columns, here in your own process.const columns = statement.columns().map(({ name }) => ({ name }));const result = classifyResult({ columns, rowCount: rows.length, rows });console.log(result.shape);
// 3. Ask the model which chart fits. It gets the question, the SQL and result.shape.const plan = await planChart({ question, sql, result, model, dialect: "sqlite" });console.log(plan);
// 4. Draw the chart yourself, from your own rows.const chart = echarts.init(null, null, { renderer: "svg", ssr: true, width: 480, height: 300 });chart.setOption({ ...toEChartsOption(plan.primary, rows), animation: false });writeFileSync("chart.svg", chart.renderToSVGString());chart.dispose();console.log("Wrote chart.svg");
Run the script one last time. The last line of the output is new:
Wrote chart.svgOpen chart.svg in a browser, for example by dragging the file onto a browser window. It should look something like this:
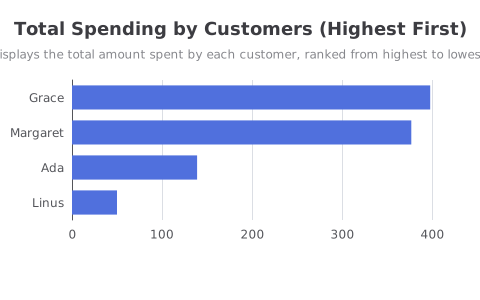
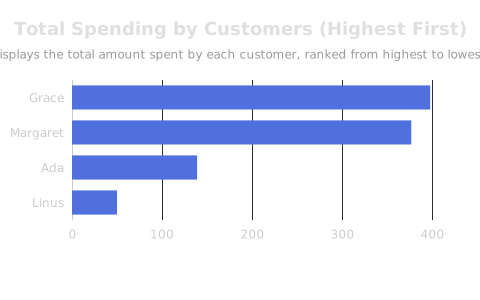
That’s your chart. ECharts drew it from the four rows your own code read from shop.db. The model chose the bars, the columns and the title, and it never saw a row.
What you built
Section titled “What you built”You asked a question from a script and ran the SQL yourself. classifyResult() described the columns in your own process. planChart() had the model pick a chart from that description, and ECharts drew the chart from your rows. AskDB returned the SQL and the chart spec. Your code did the running and the drawing.
ECharts is this tutorial’s choice, not AskDB’s. To draw with another library, replace to-echarts.mjs with a function that maps the same chart spec to that library’s config. Step 4 of Chart a query result has that mapping for shadcn/ui charts, which are Recharts, in its “shadcn/ui (Recharts)” tab. Its “ECharts” tab is this tutorial’s function. It also names the matching settings in Chart.js and Vega-Lite.
Try another question. Change question to “How many units of each product were sold?”, run the script, and open chart.svg again. The script draws any answer that has rows to group and a number to plot. Any other answer stops with an error at the drawing step, such as one number or one with no chart. Chart a query result handles those.
Use with your agent
Section titled “Use with your agent”To hand this task to a coding agent, copy the prompt and paste it into the agent.
Add a chart of a query result to this project by following the tutorial at https://askdb.tools/chart-your-first-answer.md, against this project’s own database and one of its own questions instead of the sample shop database.
The goal: a script that asks the question with
ask(), runs the SQL through the project’s own read-only connection, classifies the result withclassifyResult(), plans a chart withplanChart(), and draws it from the project’s own rows.Draw with the charting library this project already uses. Look for one in its dependencies first, such as Recharts (shadcn/ui charts are Recharts), Chart.js, ECharts, Vega-Lite or D3. If the project has none, ask which one to add; the tutorial uses ECharts. Then write one function that maps the chart spec to that library’s config, as the tutorial’s
to-echarts.mjsdoes for ECharts:typepicks the chart,categoryandseriesname columns of the rows, andtitleanddescriptionare its text.Start from a ready-made mapping when one fits. Step 4 of https://askdb.tools/guides/plan-a-chart.md has two, one in each tab:
to-echarts.mjsfor ECharts, andcomponents/spec-chart.tsx, a React component for shadcn/ui charts and Recharts. In the AskDB repo they areexamples/chart-a-result/to-echarts.mjsandexamples/chart-a-result/shadcn/components/spec-chart.tsx.
- AskDB returns SQL and a chart spec. It runs no SQL and draws nothing: this project’s code does both.
- Never put a row in a prompt.
planChart()gets the question, the SQL and the classified result.@askdb/client/chartsis experimental. For an answer that is one number, or that has no chart, follow https://askdb.tools/guides/plan-a-chart.md.
Read next
Section titled “Read next”- Chart a query result: Add the chart step to your own application, with a row cap and the cases this tutorial skipped.
- Chart planning: What the model sees, and why your application draws the chart.
- Embed in a Node app: Call
ask()from a service and run the SQL through your own database driver. - @askdb/client/charts API: Every option, type and check.
Docs for agentsllms.txtAGENTS.md
© 2026 Yahya Gilany